There's a saying that goes like this "If you fail to plan, you plan to fail". However, most of the time, you may be lost as to how to start your own financial planning to achieve financial independence (FI)? How do I even know how much income, expenses or investment return I must have in order to achieve FI? When is the age where I can finally say to my boss "I Quit"?
These are all relevant concerns which is why I created a financial independence visualisation tool which I use for my own financial planning also. I've made it easy to use so you can just input your age, income, current savings, expenses, target dividend yield, bonus, salary increment and emergency fund and the tool will calculate it all out for you.
Here's a screenshot of how the tool looks like in excel:
I'm giving this tool for free for download so do read all the way to the end for the link to download the tool.
Visualisation is powerful where it can let us see where we are currently and where we will be in the future. With visualisation, we can adjust our parameters and achieve what we want for FI. This is like seeing light at the end of the tunnel instead of being blinded by darkness if we cannot visualise where we are going.
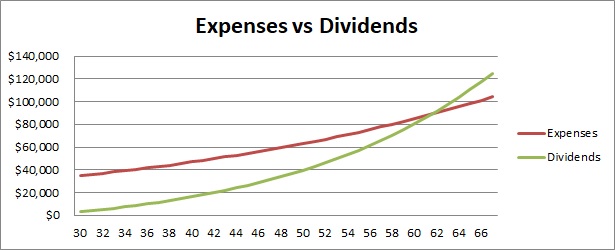
For example, if you're thinking of achieving FI when you are in your 40s, how do you do it and does your current financial situation allows you to do it? By putting in your details in the spreadsheet, you will be able to see if the dividends you receive will exceed expenses by what age?
Using the visualisation tool, a person at current age 30 with the below details will have his dividends exceed expenses at age 62 only:
For networth, this is how it will grow for the same person:
To recap, for this person, his dividends received will exceed his expenses only at the age of 62 with a networth of almost $2.2 million. This is considering he only had a $2500 monthly expenses in his 30s. Dividends he will receive annually is $91,627 while his expenses will be $90,128. That's an expenses of average $7500 per month which has increased about 2.6x in 32 years just based on an inflation rate of 3%. That's the impact of inflation it has on our lives so we must factor this in our financial planning. We will definitely need more money in the future as cost of living continues to go up.
We assume the person above consistently invests 85% of his networth at 5% investment return and he will have $2.2 million at age 62. What if this same person does not invest at all? How much will he have when he's 62? The answer is $1.1 million, half of what he would have. This is the power of compound interest through investing. In the visualisation tool, it assumes that dividends received are reinvested back so it still acts like compound interest overtime.
The tool may not be perfect but it would be the closest to what we can have to visualise our financial future. Feel free to try it and adjust the parameters and formulas to suit your needs if you feel its not too accurate for you.
You can download the tool
here and try it for free now.
Hope this helps in your financial planning!
Enjoyed my articles?
or follow me on my Facebook page and get notified about new posts.


Hi SGyounginvestment, thanks for providing this detailed calculator. I'm having problem downloading it, is the link still working?
ReplyDeleteYou can download the file from this link: https://docs.google.com/spreadsheets/d/1Nx1W_Bxa5jmlSCmWy1gtAwxWz-fQrZIl/edit?usp=drivesdk&ouid=114813268619399897992&rtpof=true&sd=true
Delete